实时行情
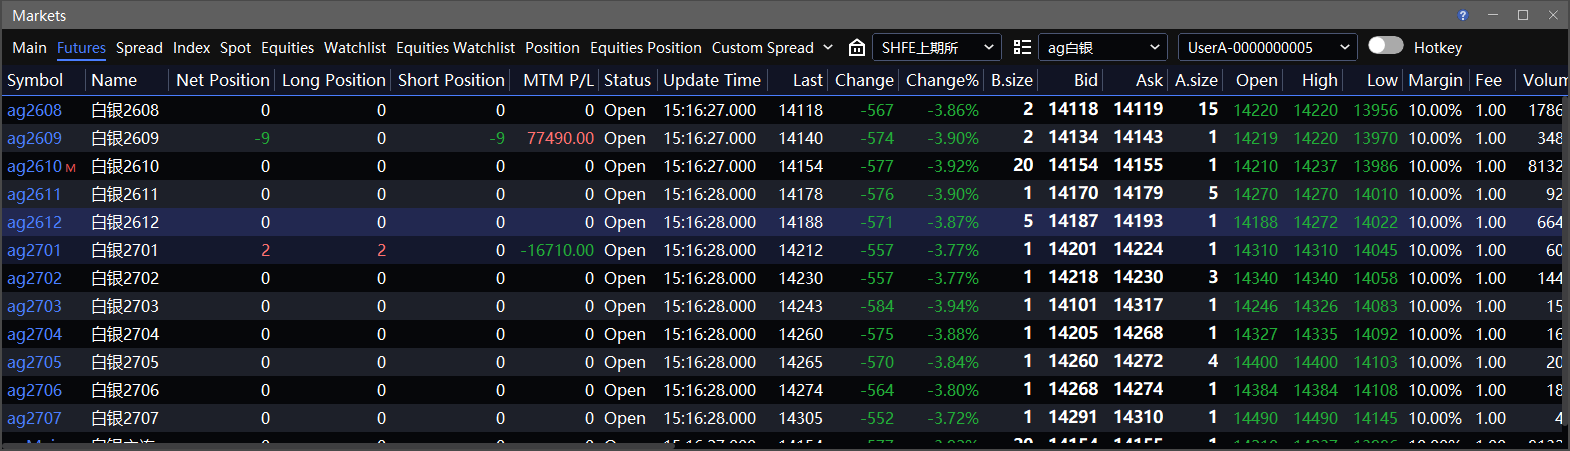
查看合约的实时行情信息。
位置:菜单 → 交易 → 实时行情
窗口交互
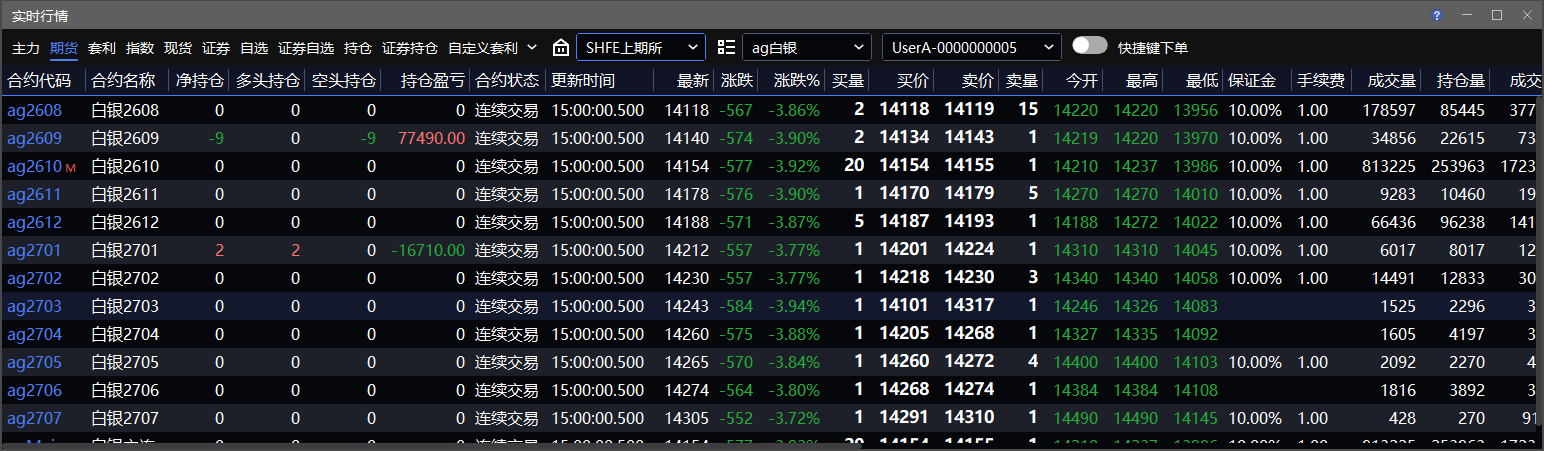
双击 买价、卖价、买量 或 卖量,可快速打开对应的下单窗口。系统默认打开 无限下单 窗口。
如需更改默认下单窗口,请前往:系统 → 交易设置 → 常规设置 → 选择双击行情弹出的下单方式。
双击实时行情中的其他区域,可快速打开对应合约的 行情线图 窗口。
当下单窗口或线图窗口开启 窗口联动 后,点击实时行情中的合约,合约信息和账号将同步至已联动的窗口。
价格联动: 点击 买价、卖价、最新价 等价格单元格时,该单元格中的价格也会同步至已联动的窗口。带入的价格取决于鼠标焦点所在的价格单元格。
行情信息
合约状态: 显示当前合约所处的交易状态。正常开盘交易时显示为 连续交易;其他状态包括 开盘前、非交易、集合竞价报单 和 收盘 等。
更新时间: 显示合约上一笔行情的推送时间,并非当前时间。因网络问题出现行情延迟时,可通过该时间检查行情是否及时更新。
手续费/保证金: 显示上层系统返回的手续费率和保证金率。点击该栏位的空白处可查询费率。
主连合约与主力合约
主连合约在行情中的代码格式为 agMain,其中 ag 表示品种代码。
主力合约在行情中显示为 ag2102M。
每天收盘时,持仓量和成交量均较高的合约为主力合约。系统在每个交易日收盘时检查并切换主力合约。
自选行情
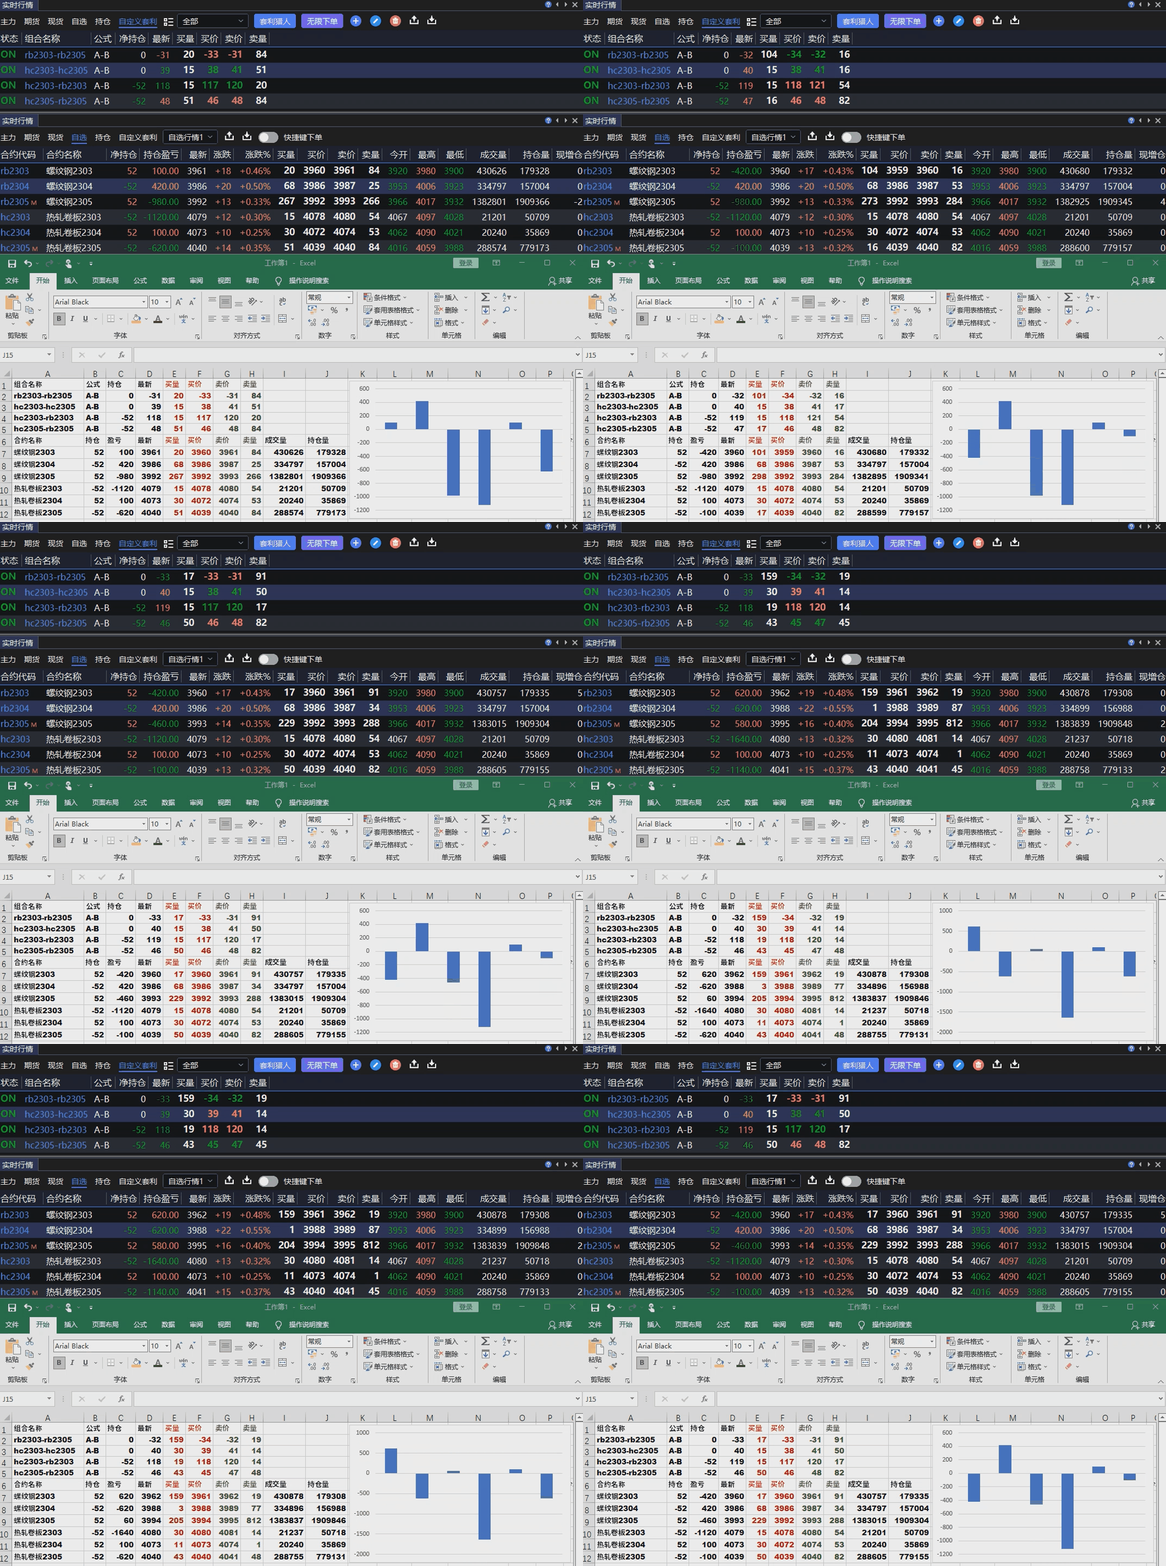
在 实时行情 窗口的右键菜单中,可将当前合约添加至自选行情组,也可打开 自选行情 窗口。详见 自选行情 。
快捷键下单
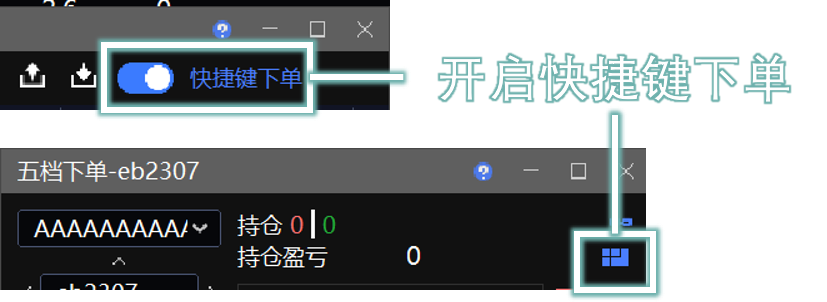
开启右上角的 快捷键下单 后,可使用键盘快捷键对合约下单。详见 交易设置 。
仅当 实时行情 窗口处于选中状态(选中的嵌入窗口带有蓝色边框),并且已开启 快捷键下单 时,才能使用快捷键下单。
实时行情 窗口不提供开平仓方式和数量选项。开平仓方式默认为 自动(平今优先),数量默认为
1,且不能修改。请使用热键切换开平仓方式。
导出动态行情 DDE
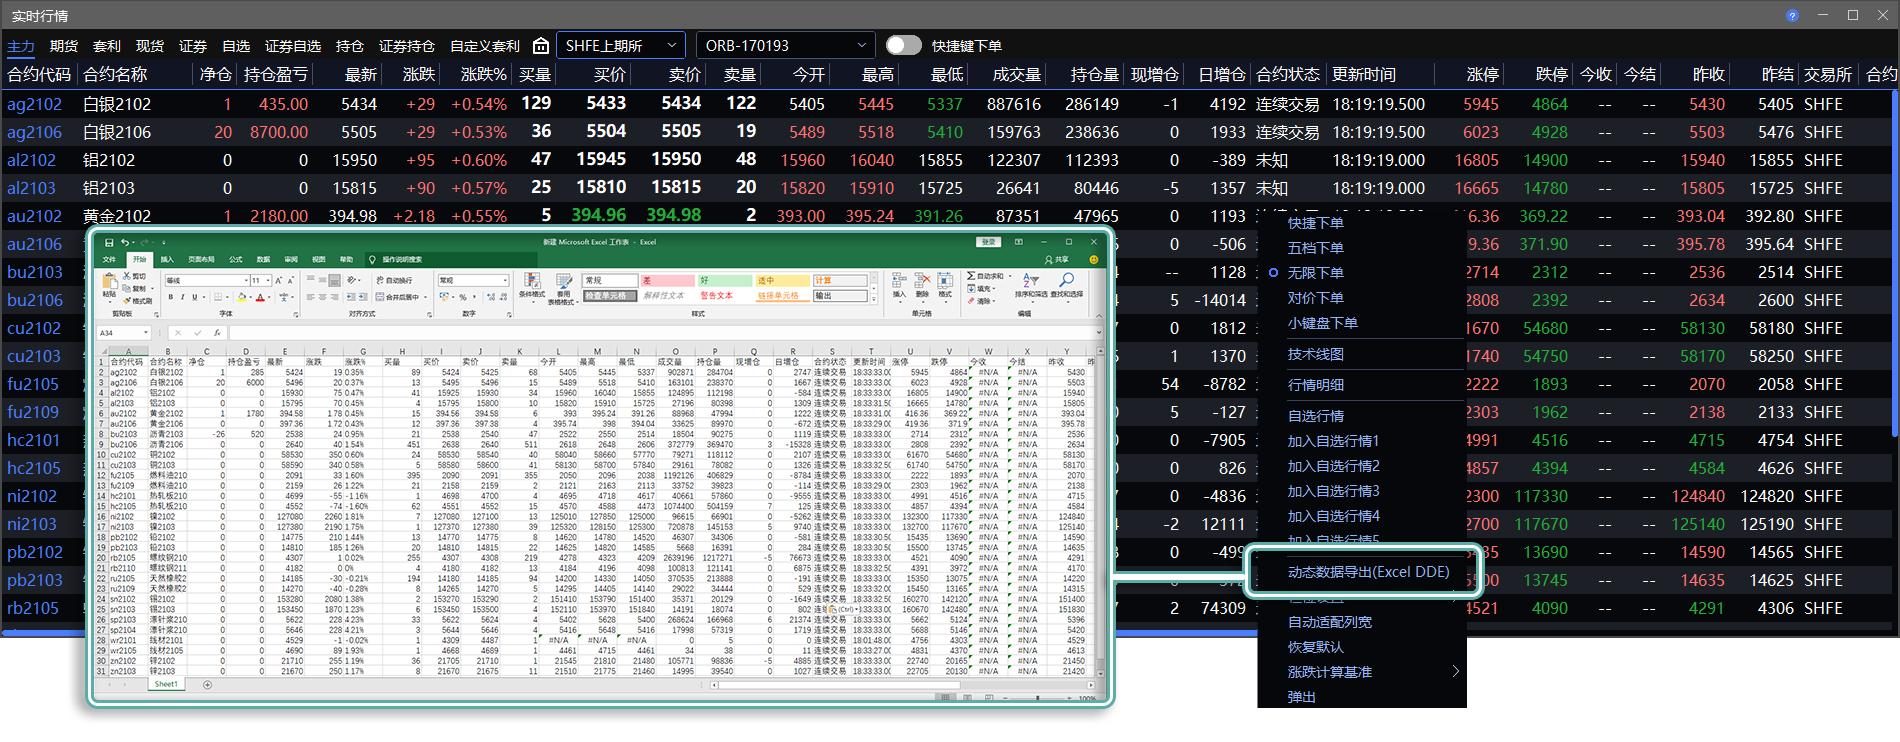
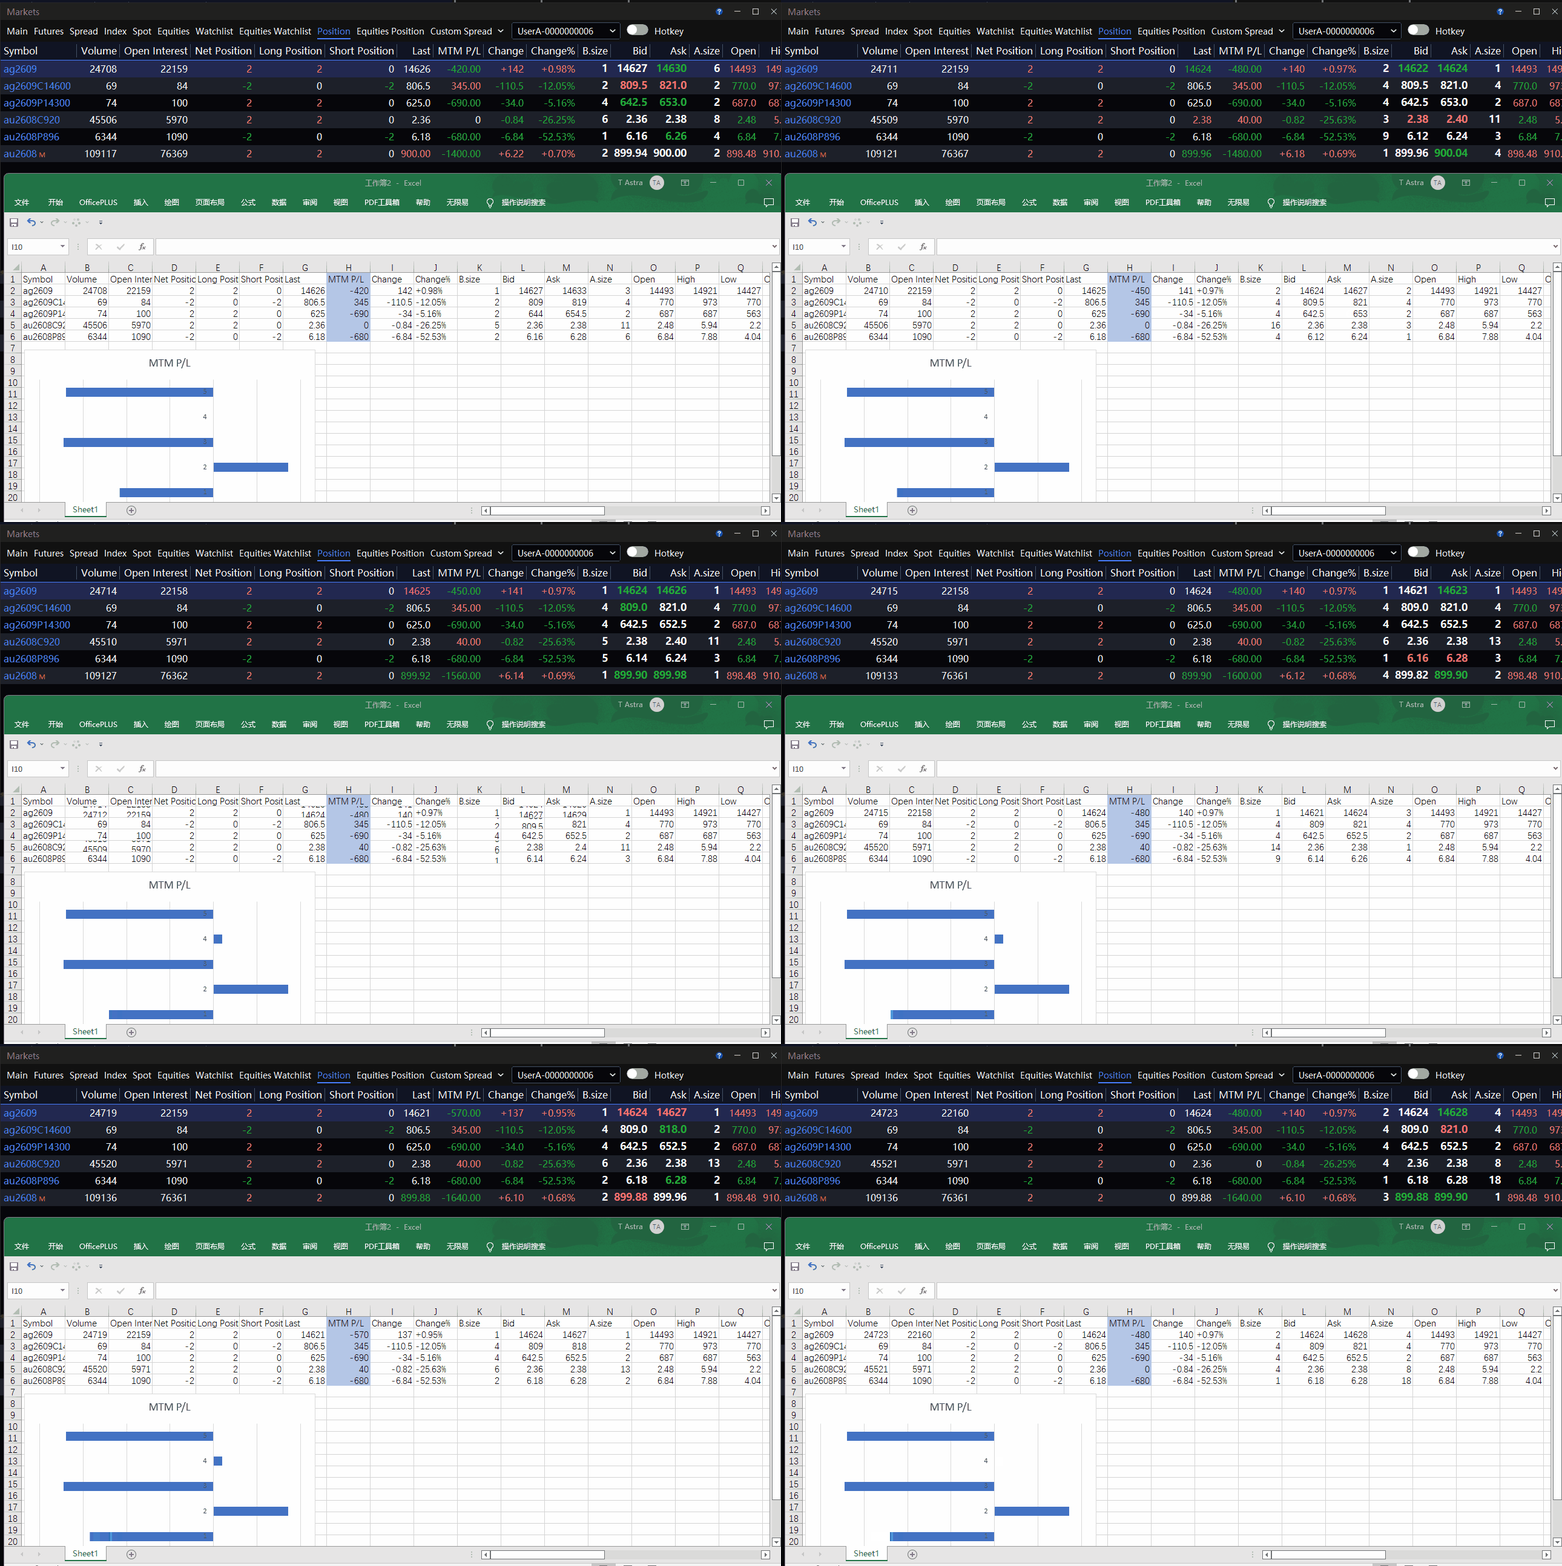
可导出行情、持仓、盈亏等动态数据,并使用 Excel 函数进行统计分析。详见 Excel DDE 。
VIX
VIX 反映市场对未来 30 天波动率的预期。
算法核心步骤
选取剩余到期日大于 7 天的最近到期合约作为近月合约,次近到期合约作为次近月合约。
计算近月和次近月波动率:
其中:
NT 为合约剩余到期时间(以分钟计),N365 是一年的分钟数(固定值)。
R:无风险利率。
S:认购期权价格与认沽期权价格相差最小的执行价。
F:S + eRT × [认购期权价格(S) − 认沽期权价格(S)]。
Ki:由小到大排列的所有执行价(i = 1, 2, 3, …)。
K0:小于 F 且最接近 F 的执行价。
ΔKi:第 i 个执行价对应的执行价间隔,通常为 (Ki+1 − Ki−1) / 2。
P(Ki):当 Ki < K0 时,取 Ki 对应的认沽期权价格;当 Ki > K0 时,取 Ki 对应的认购期权价格;当 Ki = K0 时,取 Ki 对应的认沽期权与认购期权价格的平均值。
期权价格选择规则
当日有成交时,取最新价。
当日无成交时,取昨结算价。
合约进入熔断状态时,如有虚拟成交价格,则取虚拟成交价格;否则取熔断前确定的价格。
如果某个期权没有以上任何一种价格,则不将其纳入波动率计算。
计算 VIX:
其中:
σ1、σ2 分别为近月和次近月波动率。
NT1、NT2 分别为近月和次近月合约的剩余到期时间(以分钟计)。
N30、N365 分别为 30 天和一年的分钟数。
T1 = NT1 / N365,T2 = NT2 / N365。
加权指数
该品种所有月份合约的最新价按照持仓量占比加权计算,得到加权指数合约的价格。
Markets
View real-time market data for instruments.
Path: Menu → Trade → Markets
Window Interaction
Double-click Bid, Ask, B.size, or A.size to open the corresponding order entry window. By default, the InfiniTrader window opens.
To change the default order entry window, go to Systems → Settings → General Settings, then select the order entry window opened by double-clicking market data.
Double-click anywhere else in Markets to open Market Charts for the selected instrument.
When Link is enabled in an order entry window or chart window, clicking an instrument in Markets syncs the instrument details and Account to the linked window.
Price linking: When you click a price cell, such as Bid, Ask, or Last, the value in that cell is also passed to the linked window. The price passed to the window depends on the price cell under the mouse pointer.
Market Information
Status: Shows the current trading status of the instrument. During normal market hours, the status is Open. Other statuses include Pre-Trade, Halted, AuctionOrdering, and Closed.
Update Time: Shows the time when the most recent market data update for the instrument was received, not the current time. If market data is delayed because of a network issue, check this value to determine whether the data is updating.
Fee/Margin: Shows the fee and margin rates returned by the upstream system. Click a blank cell in this column to query the rates.
Continuous and Dominant Contracts
A continuous contract uses a code such as agMain, where ag is the product code.
A dominant contract is identified by an M suffix, such as ag2102M.
At the close of each trading day, the contract with both high Open Interest and Volume is designated as the dominant contract. The dominant contract is reviewed and may be switched after each trading-day close.
Watchlist
From the context menu in Markets, add the current instrument to a watchlist group or open the Watchlist window. See Watchlist for details.
Hotkey Order Entry
Enable Hotkey in the upper-right corner to place orders for instruments using keyboard shortcuts. See Settings for details.
Hotkeys are available only when the Markets window is selected and Hotkey is enabled. A selected embedded window has a blue border.
The Markets window does not provide open/close or quantity controls. The default open/close setting is Auto(DayTrade First), and the default quantity is
1. These defaults cannot be changed. Use hotkeys to switch the open/close action.
Export Dynamic Data with DDE
Export dynamic market data, positions, P&L, and other data for analysis with Excel functions. See Excel DDE for details.
VIX
VIX reflects the market's expectation of volatility over the next 30 days.
Calculation
Select the nearest-expiry contract with more than seven days remaining as the near-term contract, and the next expiry as the next-term contract.
Calculate the near-term and next-term variances:
Where:
NT is the time remaining to expiration, in minutes. N365 is the number of minutes in one year (a fixed value).
R: Risk-free interest rate.
S: Strike price with the smallest difference between the call and put prices.
F: S + eRT × [call price(S) − put price(S)].
Ki: All strike prices in ascending order (i = 1, 2, 3, …).
K0: Strike price immediately below and closest to F.
ΔKi: Strike interval for the ith strike, generally calculated as (Ki+1 − Ki−1) / 2.
P(Ki): The put price at Ki when Ki < K0; the call price at Ki when Ki > K0; or the average of the put and call prices at Ki when Ki = K0.
Option price selection
If the option traded today, use the Last price.
If the option did not trade today, use the previous settlement price.
If the contract is under a volatility interruption, use the indicative execution price when available. Otherwise, use the price determined before the interruption.
Exclude an option from the variance calculation if none of these prices is available.
Calculate VIX:
Where:
σ1 and σ2 are the near-term and next-term variances, respectively.
NT1 and NT2 are the times remaining to expiration for the near-term and next-term contracts, respectively, in minutes.
N30 and N365 are the numbers of minutes in 30 days and one year, respectively.
T1 = NT1 / N365 and T2 = NT2 / N365.
Weighted Index
The Weighted Index price is calculated from the Last prices of all contract months for the product, weighted by each contract's share of total Open Interest.