技术线图
技术线图支持标准合约和自定义套利组合,可查看 K 线、收盘线、BAR(美国线)和 TOWER(宝塔线)。
位置:菜单 → 线图 → 行情线图
缩放
滚动鼠标滚轮可放大或缩小线图;按住鼠标左键并拖动,可左右移动线图。
窗口联动
点击实时行情或持仓窗口中的合约,可将该合约快速带入行情线图。点击行情线图左上角的联动开关,可开启或关闭联动功能。
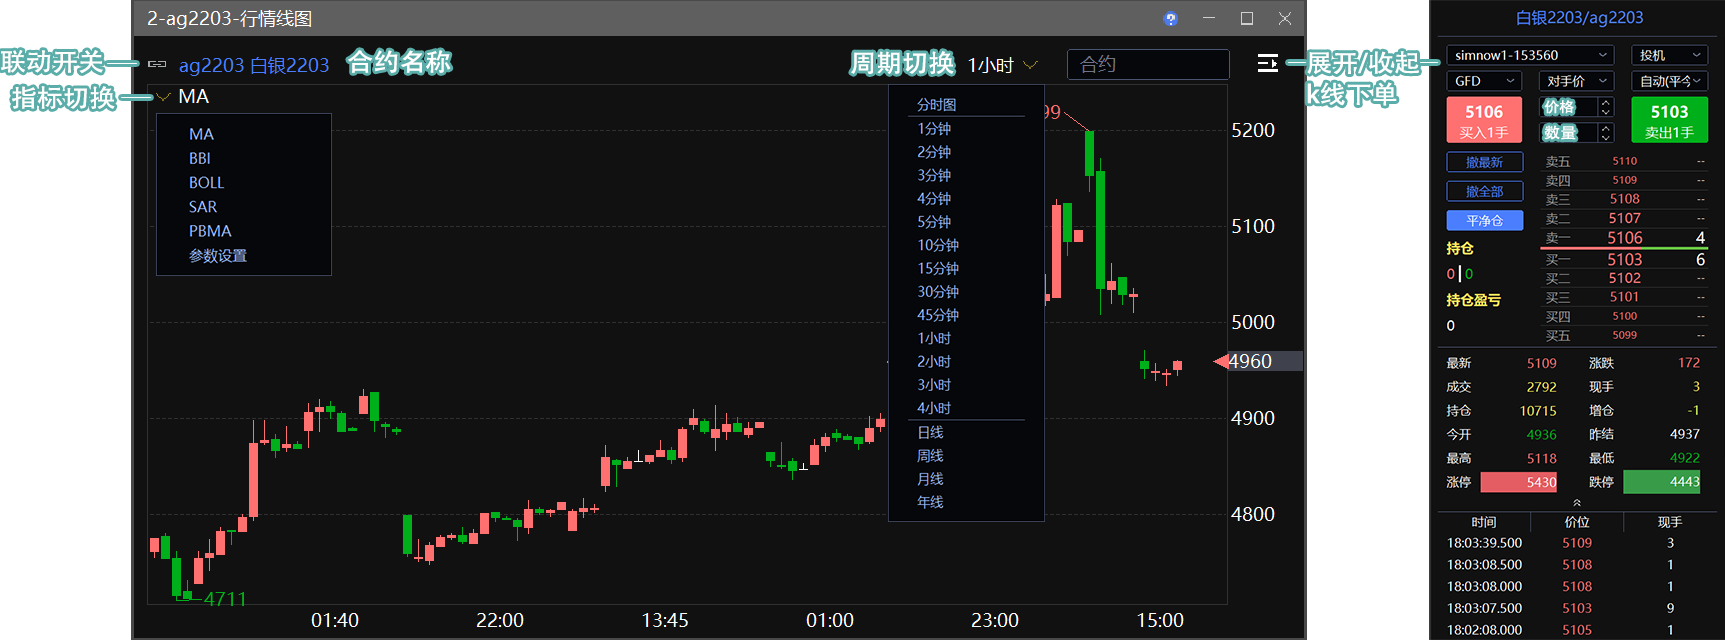
指标切换及修改指标参数
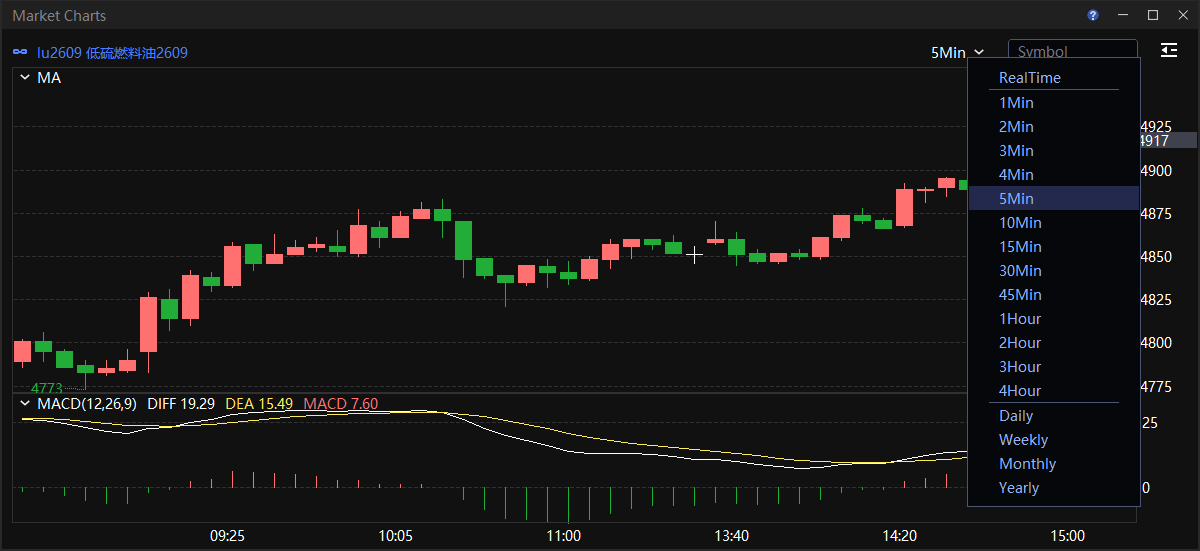
在主图或副图左上角打开指标下拉框,即可切换指标。添加副图的位置:右键菜单 → 增加副图。
在指标下拉框中点击 参数设置,即可修改指标参数。
如需清空指标,请在 参数设置 中点击 清空参数,或删除参数输入框中的数字。
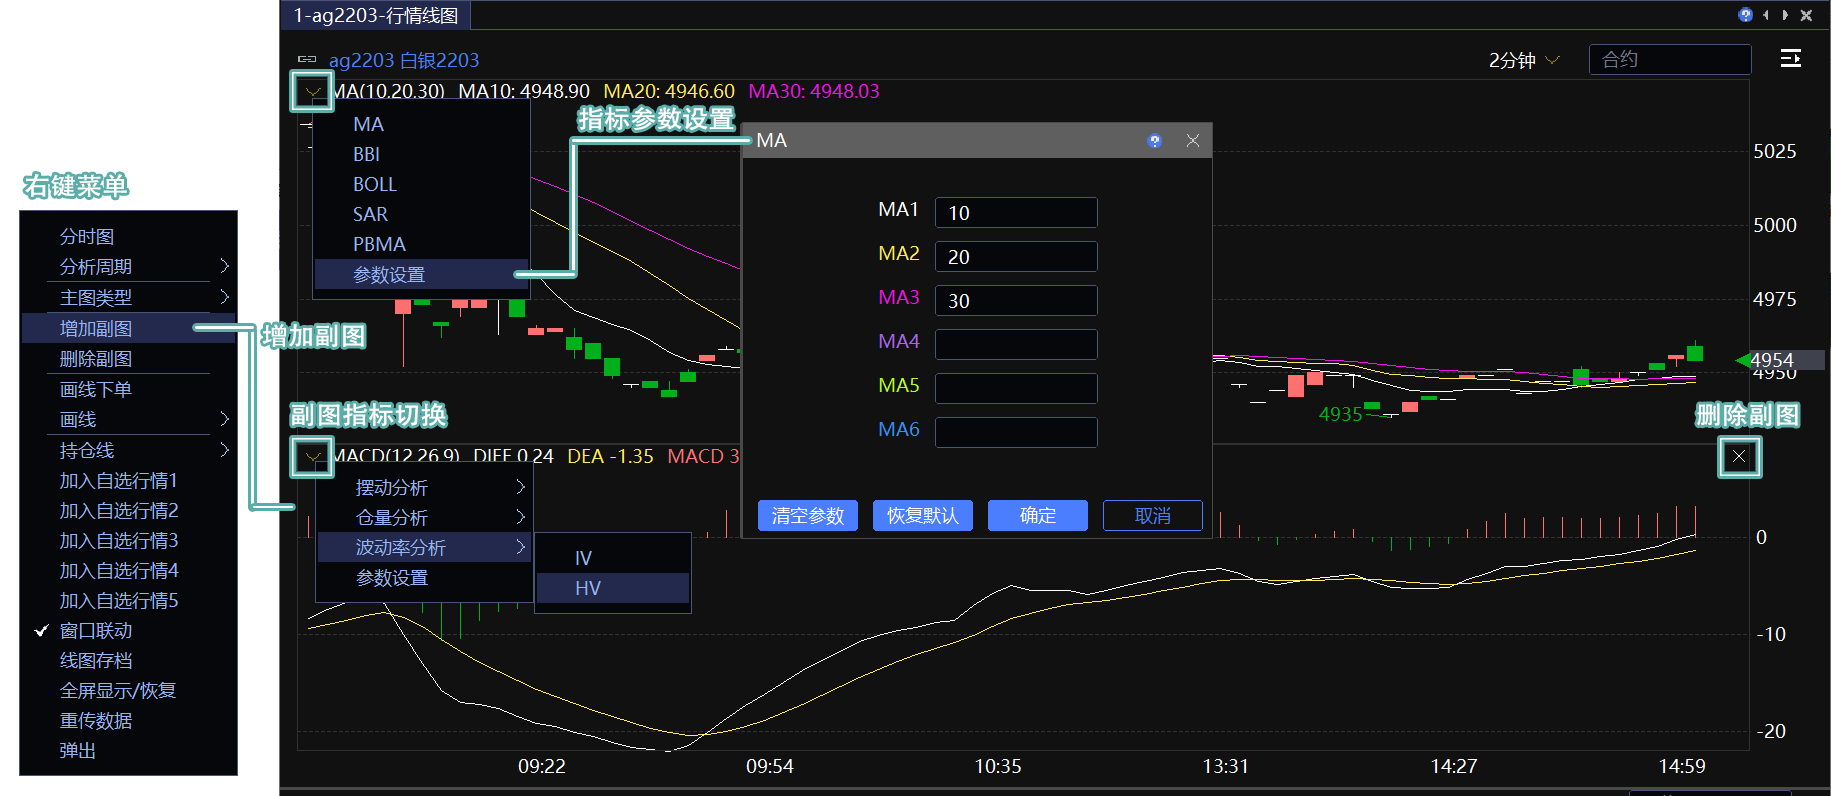
⚠️ 需要先将右上角的周期切换为非分时图,才能增加副图或切换指标。
多股同列
如需在同一界面中显示多个技术线图,请打开多个 K 线窗口并自行调整窗口。具体操作请参阅 调整窗口布局方法 。
持仓线
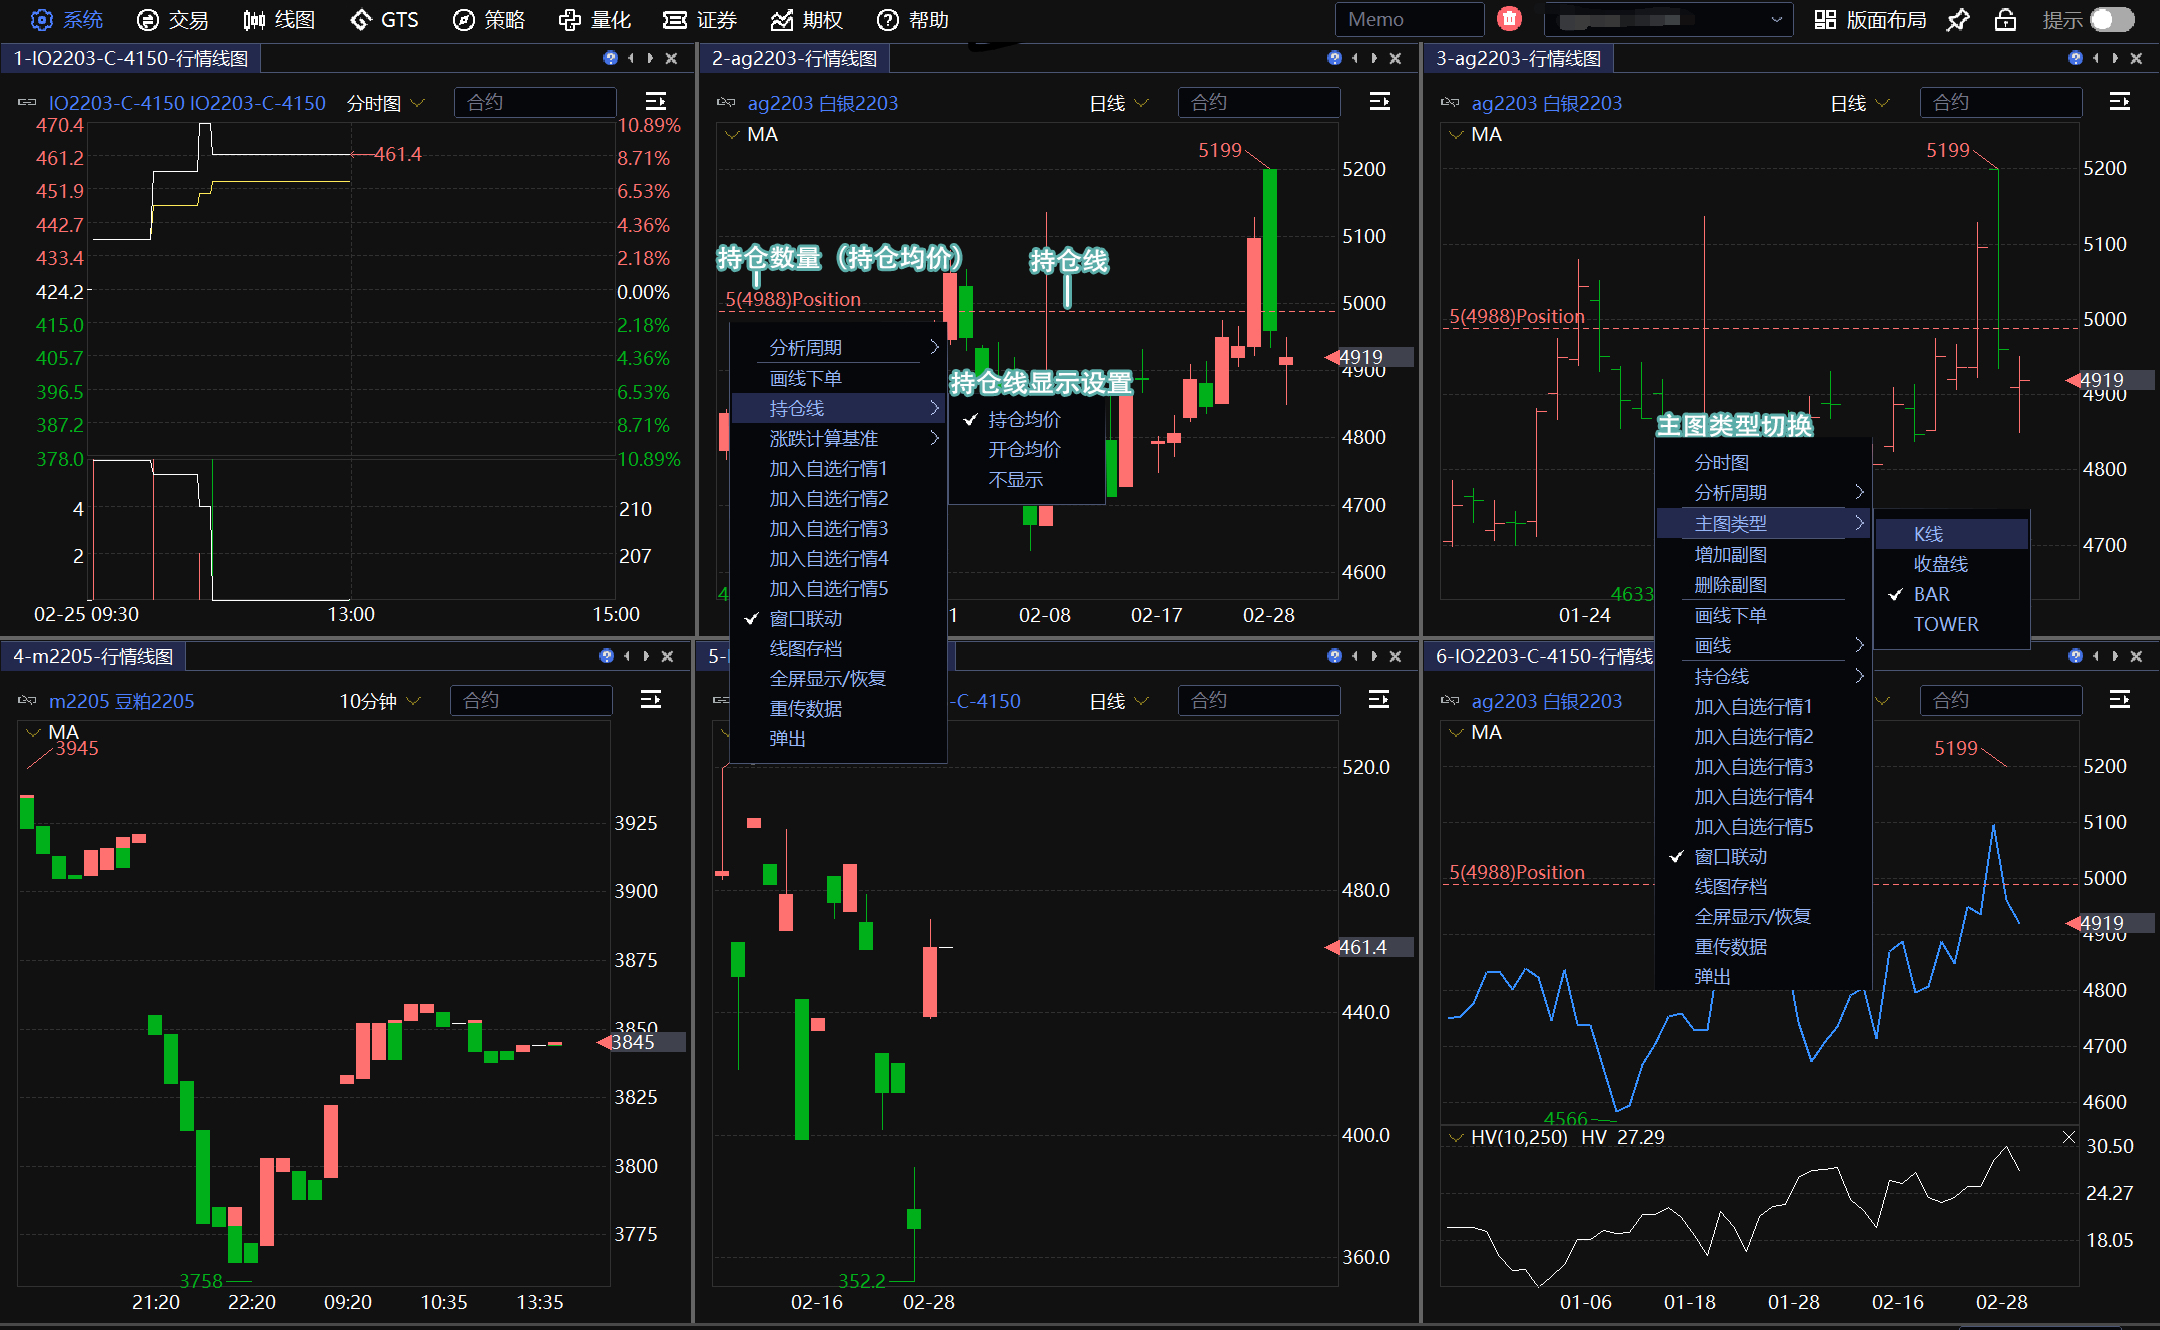
合约有持仓时,系统默认显示持仓线、持仓数量和仓位均价。红色线表示多头持仓,绿色线表示空头持仓。
均价计算标准
在右键菜单中选择 持仓线,可切换均价计算标准:
持仓均价:以持仓价(逐日)计算均价。
开仓均价:昨仓以开仓价(逐笔)计算均价。
隐藏持仓线
在右键菜单中选择 持仓线 → 不显示。
拖动持仓线画线下单
拖动持仓线可触发画线下单,并按全部持仓数量提交止盈止损单。使用该功能前,需要在 交易设置 → 常规设置 中勾选 拖动技术线图的持仓线,以画线下单形式,根据所有持仓数量下止盈或止损单。
画线下单
通过画线委托价格触发类型的算法单。具体操作请参阅 画线下单 。
主图类型切换
在右键菜单中选择 主图类型,可切换 K 线 1(实心 K 线)、K 线 2(空心 K 线)、收盘线、BAR(美国线)或 TOWER(宝塔线)。
套利 K 线
技术线图支持查看以下套利组合的组合 K 线:
交易所标准套利合约。
期权套利合约。
自定义套利组合:用于创建非交易所标准的多合约价差组合,可自定义价差计算公式。查看组合 K 线前,需要先 创建自定义套利组合 。
组合 K 线不支持分时图。可将周期切换为 1 分钟,并将主图类型切换为 收盘线,以获得与分时图相近的显示效果。
历史组合 K 线使用行情切片数据合成,不显示影线。多个合约在同一周期内的最高价和最低价可能出现在不同时间,因此合成后的最高价和最低价没有参考意义。
详情请观看 视频:组合 K 线线图原理。
主图指标说明
MA
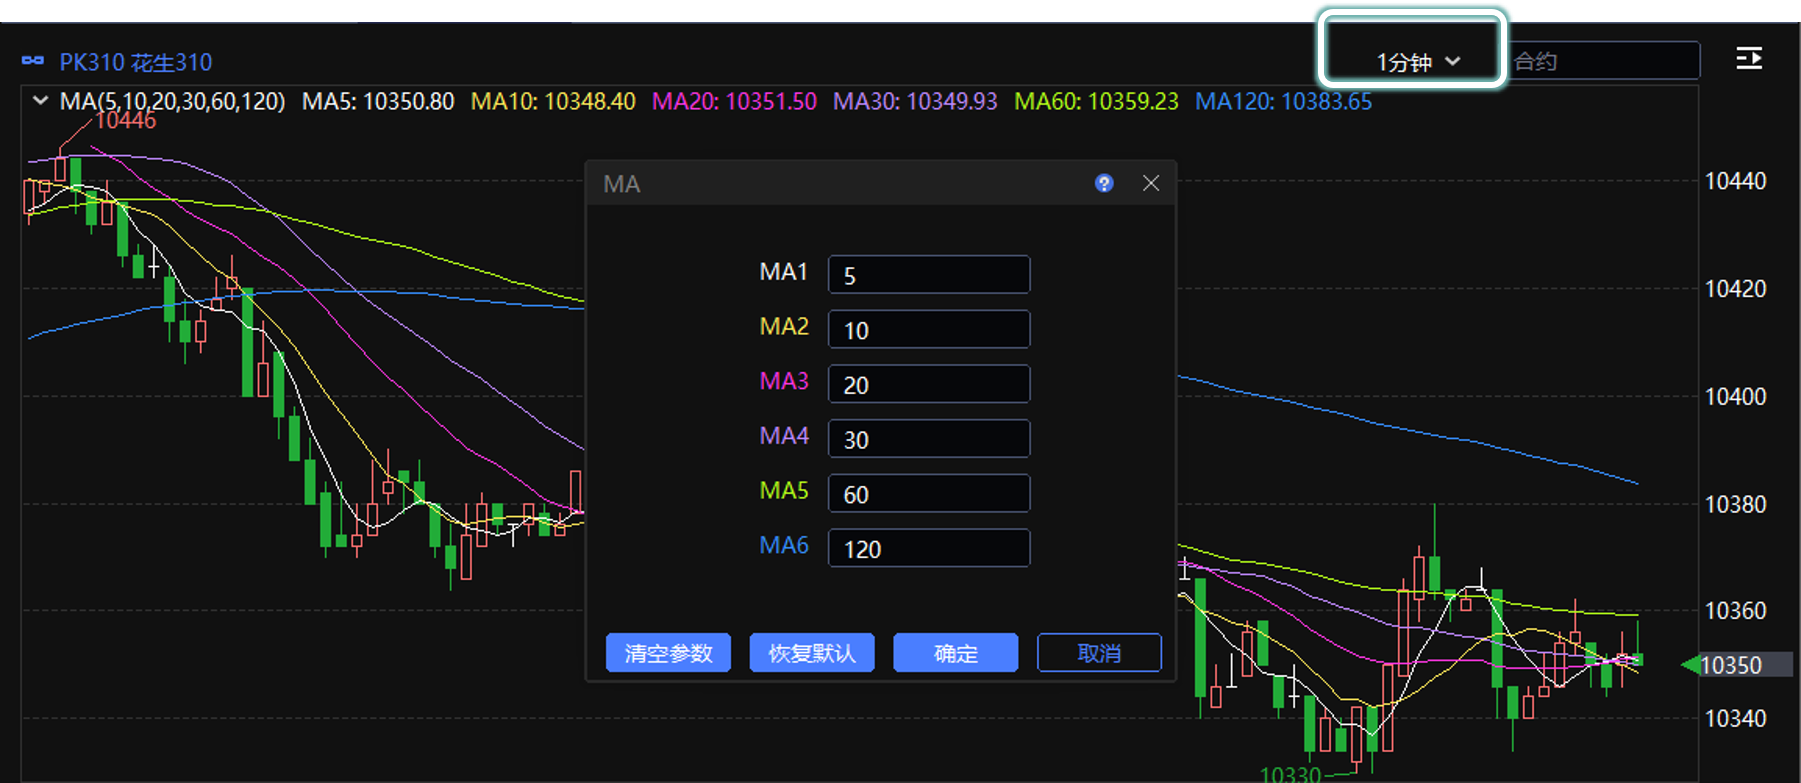
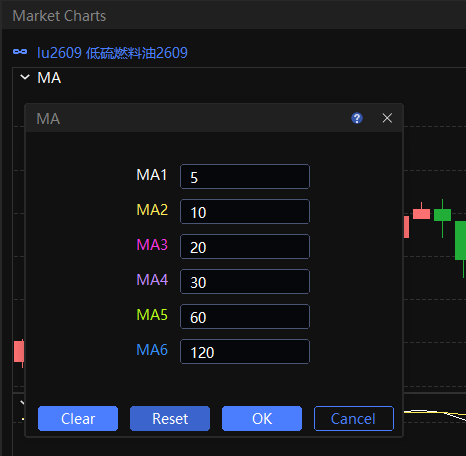
参数 MA1~MA6 表示 MA 的计算周期。周期单位(分钟、小时或日等)以右上角的周期设置为准。
例如,下图中的 MA1 表示 5 分钟 MA,MA2 表示 10 分钟 MA,以此类推。
BBI
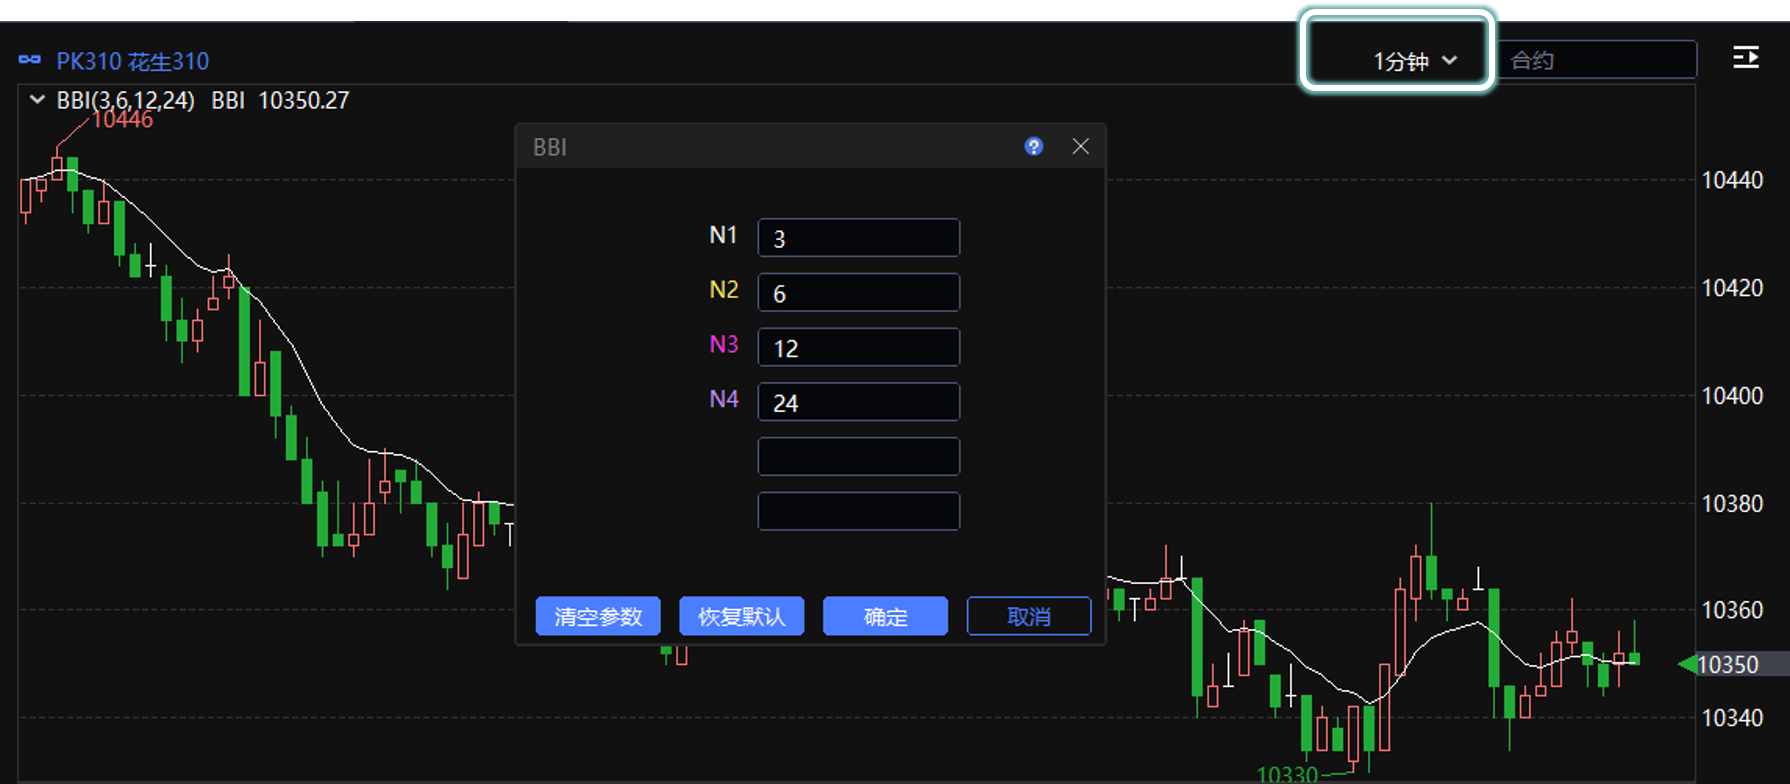
参数 N1~N4 表示移动平均周期。
按下图参数设置,BBI =(3 分钟均价 + 6 分钟均价 + 12 分钟均价 + 24 分钟均价)/ 4。
BOLL
参数 N 表示均线周期,M 表示均线标准差周期,P 表示标准差倍数。
SAR
SAR 是止损转向操作点指标(Stop and Reverse)的缩写,通常称为抛物线指标。参数 N 表示周期,STEP 表示步长,MVALU 表示反向临界参数。
PBMA
PBMA(Progressive Build-Measure-Analyze)的参数 PBMA1~PBMA6 表示 PBMA 的计算周期。
EXPMA
参数 MA1~MA6 表示 EMA 周期。
副图指标说明
摆动分析
MACD
MACD 主要由正负差(DIF)、异同平均数(DEA)和柱状线(BAR)组成。
参数 SHORT、LONG 和 M 是无限易面板中设置的参数,Yd 表示昨日值。
KDJ
参数 N 表示 RSV 值的计算周期,M1 表示 K 值的计算周期,M2 表示 D 值的计算周期。
RSI
参数 N1 和 N2 表示 RSI 的计算周期。
BIAS
参数 L1~L3 表示 BIAS 的计算周期。
DMI
参数 N 表示统计天数,M 表示计算时的间隔天数。
MTM
动量值(MTM)= 当日收盘价 − N 日前收盘价
动量均值(MTMMA)= 动量指标的 N1 日移动平均值
参数 N 和 N1 是在无限易中输入的参数。无限易将 MTMMA 显示为 MA。
PSY
PSY = N 日内上涨天数 / N × 100
PSYMA = PSY 的 M 日移动平均值
参数 N 表示 PSY 计算周期,M 表示移动平均周期。
CCI
参数 N 表示 CCI 计算周期,MA 表示 CCI 移动平均周期,与 PSYMA 和 MTMMA 类似。
ATR
参数 N 表示 ATR 计算周期。
仓量分析
VOLUME
参数 MA1~MA6 表示 VOLUME 移动平均线的周期。
CR
参数 N 表示 CR 的计算周期,MA1~MA4 表示 CR 的移动平均周期。
VR
参数 N 表示 VR 的计算周期。
波动率分析
IV
IV 显示隐含波动率走势。
计算 IV 时使用的无风险利率为 Shibor 一年期指标,每季度更新一次,更新日期为每年的 01/01、04/01、07/01 和 10/01。
HV
参数 N 表示波动率计算周期,M 表示每年的交易日天数,用于计算年化波动率。
Technical Chart
Technical Chart supports standard instruments and custom spreads. You can view candlesticks, close lines, BAR (American bars), and TOWER charts.
Location: Menu → Chart → Market Chart
Zoom and Pan
Scroll the mouse wheel to zoom in or out. Hold down the left mouse button and drag to move the chart horizontally.
Window Linkage
Click an instrument in the real-time quotes or positions window to load it into Market Chart. Use the linkage switch in the upper-left corner of Market Chart to enable or disable window linkage.
Switch Indicators and Modify Parameters
Open the indicator drop-down list in the upper-left corner of the main chart or sub-chart to switch indicators. To add a sub-chart, right-click and select Add Tech.
Click Params Set in the indicator drop-down list to modify the indicator parameters.
To clear an indicator, open Params Set and click Clear, or delete the numbers from the parameter input fields.
⚠️ Switch the period in the upper-right corner from the time-sharing chart to another period before adding a sub-chart or switching indicators.
Multiple Charts in One Window
To display multiple Technical Charts on the same screen, open multiple candlestick windows and arrange them as needed. See Adjust the Window Layout for instructions.
Position Lines
When an instrument has an open position, the chart displays a position line, position quantity, and average position price by default. A red line represents a long position, and a green line represents a short position.
Average Price Calculation
Right-click and select Position Line to change the calculation method:
Average Position Price: Calculates the average using the daily position price.
Average Open Price: Calculates the average price of previous-day positions using trade-by-trade open prices.
Hide Position Lines
Right-click and select Position Line → Unshow.
Drag a Position Line to Submit a Line Order
Drag a position line to activate Line Trader and submit a bracket order for the entire position quantity. Before using this feature, open Trade Settings → General Settings and select Drag the position line on the Technical Chart to place a take-profit or stop-loss line order for the entire position quantity.
Line Trader
Draw a line to submit a price-triggered algorithmic order. See Line Trader for details.
Change the Chart Type
Right-click and select Chart Type to switch between Candle 1 (filled candlesticks), Candle 2 (hollow candlesticks), close line, BAR (American bars), and TOWER.
Spread K-lines
Technical Chart supports spread K-lines for exchange standard spread contracts, option spread contracts, and Custom Spreads.
Custom Spread is used to create non-exchange-standard multi-contract spreads. You can define the spread formula. Before viewing its spread K-line chart, create a Custom Spread first.
Spread K-lines do not support intraday charts. To get a similar effect, switch the period to 1 minute and set the main chart type to Close Line.
Historical data does not support wicks. Historical spread data is slice-based. For multiple contracts in the same period, the combined high and low may not occur at the same time, so the wick has limited reference value.
For details, watch Video: How Spread K-line Charts Work.
Main Chart Indicators
MA
MA1–MA6 specify the MA calculation periods. The period unit—minutes, hours, or days—is determined by the period setting in the upper-right corner.
For example, with the settings shown below, MA1 represents the 5-minute MA and MA2 represents the 10-minute MA.
BBI
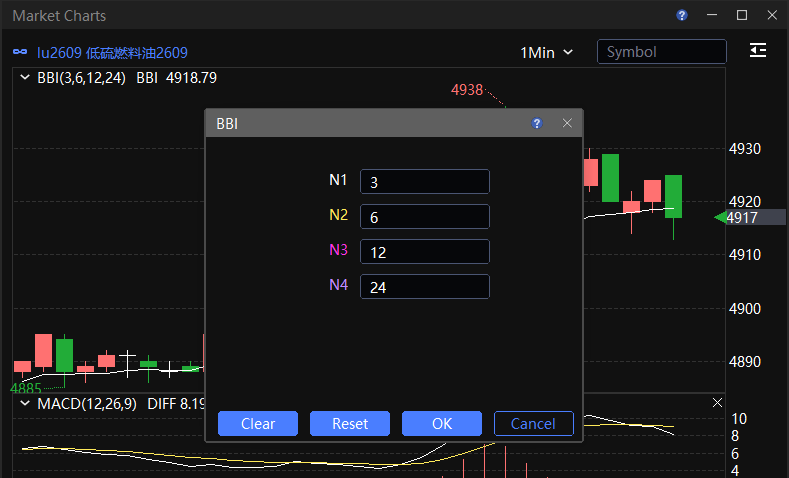
N1–N4 specify the moving-average periods.
With the settings shown below, BBI = (3-minute average price + 6-minute average price + 12-minute average price + 24-minute average price) / 4.
BOLL
N specifies the moving-average period, M specifies the standard-deviation period, and P specifies the standard-deviation multiplier.
SAR
SAR stands for Stop and Reverse and is commonly known as the parabolic indicator. N specifies the period, STEP specifies the step size, and MVALU specifies the reversal threshold.
PBMA
For PBMA (Progressive Build-Measure-Analyze), PBMA1–PBMA6 specify the calculation periods.
EXPMA
MA1–MA6 specify the EMA periods.
Sub-chart Indicators
Oscillator Analysis
MACD
MACD consists primarily of the difference (DIF), signal line (DEA), and histogram (BAR).
SHORT, LONG, and M are configured in InfiniTrader. Yd indicates the previous day's value.
KDJ
N specifies the RSV calculation period, M1 specifies the K calculation period, and M2 specifies the D calculation period.
RSI
N1 and N2 specify the RSI calculation periods.
BIAS
L1–L3 specify the BIAS calculation periods.
DMI
N specifies the number of days included in the calculation, and M specifies the interval in days.
MTM
Momentum (MTM) = Current close − Close N days ago
Average momentum (MTMMA) = N1-day moving average of MTM
N and N1 are entered in InfiniTrader. InfiniTrader displays MTMMA as MA.
PSY
PSY = Number of rising days within N days / N × 100
PSYMA = M-day moving average of PSY
N specifies the PSY calculation period, and M specifies the moving-average period.
CCI
N specifies the CCI calculation period. MA specifies the CCI moving-average period, similar to PSYMA and MTMMA.
ATR
N specifies the ATR calculation period.
Volume Analysis
VOLUME
MA1–MA6 specify the periods of the VOLUME moving averages.
CR
N specifies the CR calculation period. MA1–MA4 specify the CR moving-average periods.
VR
N specifies the VR calculation period.
Volatility Analysis
IV
IV displays the implied volatility trend.
The risk-free rate used to calculate IV is the one-year Shibor rate. It is updated quarterly on January 1, April 1, July 1, and October 1.
HV
N specifies the volatility calculation period. M specifies the number of trading days per year and is used to annualize volatility.